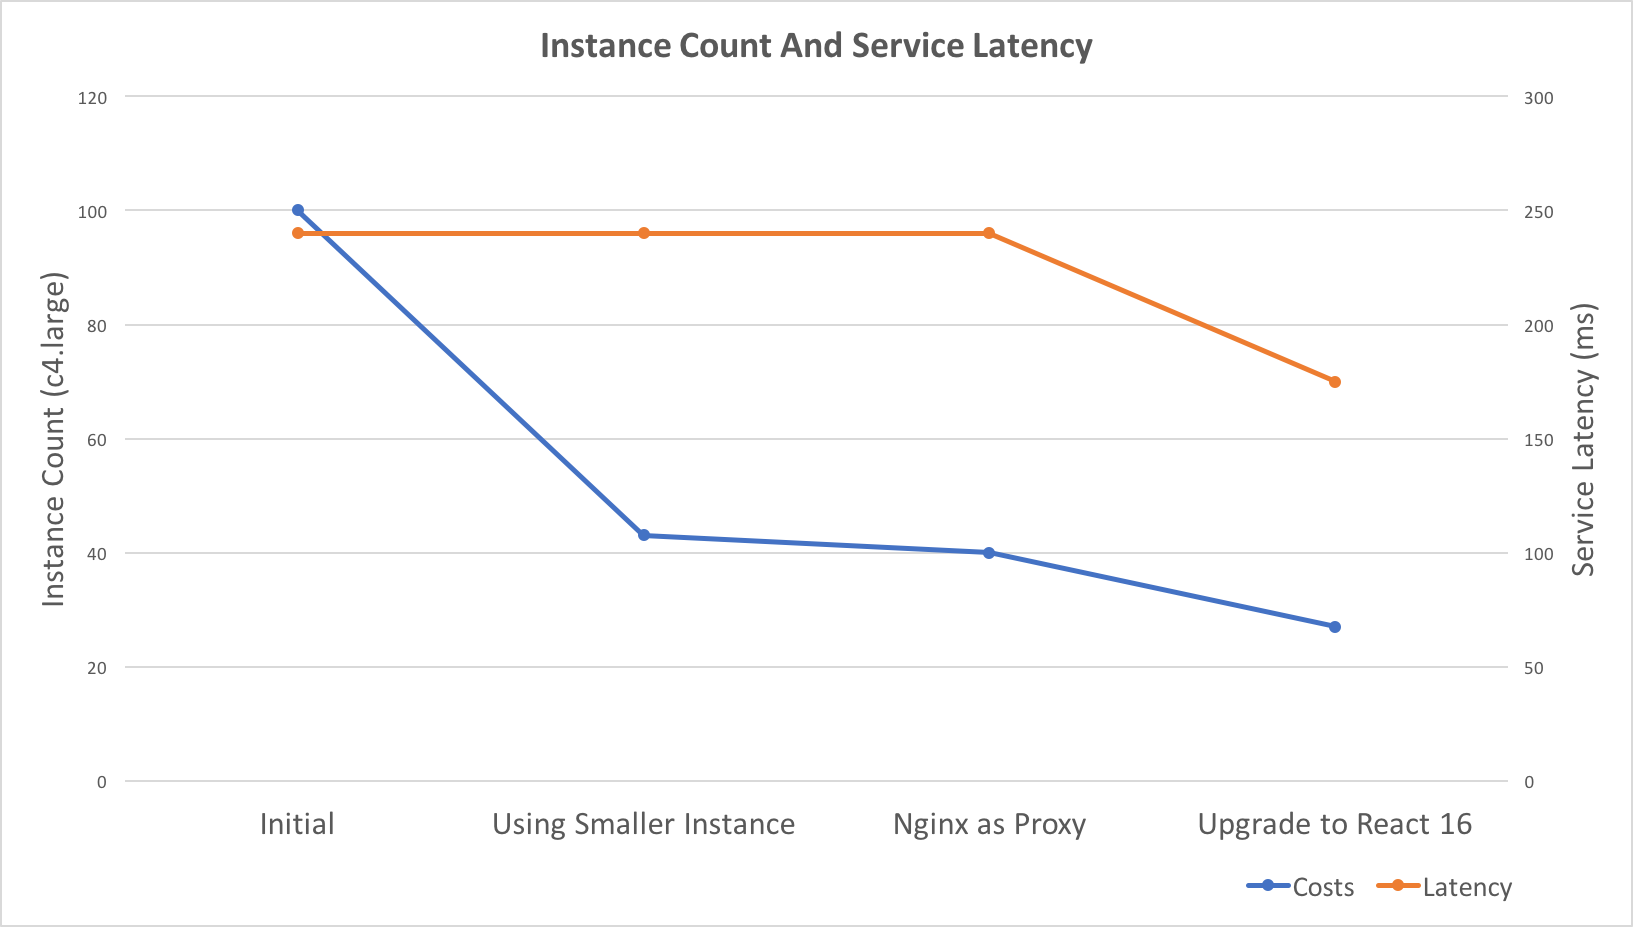
Recently, I did some work related to auto-scaling and performance tuning. As a result, the costs reduced to 27% and service latency improved 25%.
Takeaways
- React Server Side Render performs not good under Nodejs Cluster, consider using a reverse proxy, e.g. Nginx
- React V16 Server Side Render performs much faster than V15, 40% in our case
- Use smaller instances to get better scaling granularity if possible, e.g. change C4.2xLarge to C4.Large
- AWS t2.large performs 3 times slower than C4.large on React Server Side Render
- AWS Lambda performs 3 times slower than C4.large on React Server Side Render
- There’s a race condition in Nginx http upstream keepalive module which generates 502 Bad Gateway errors (104 connection reset by peer)
Background
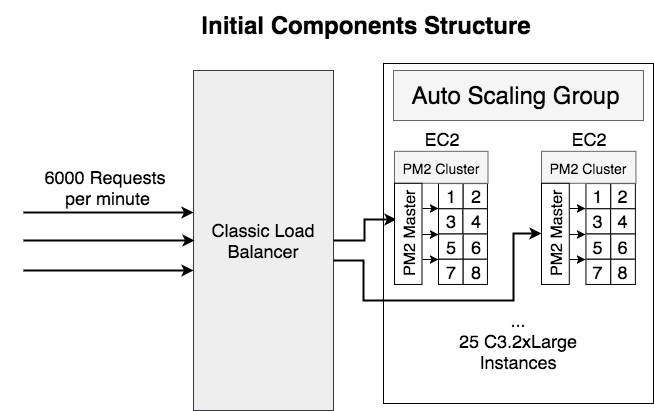
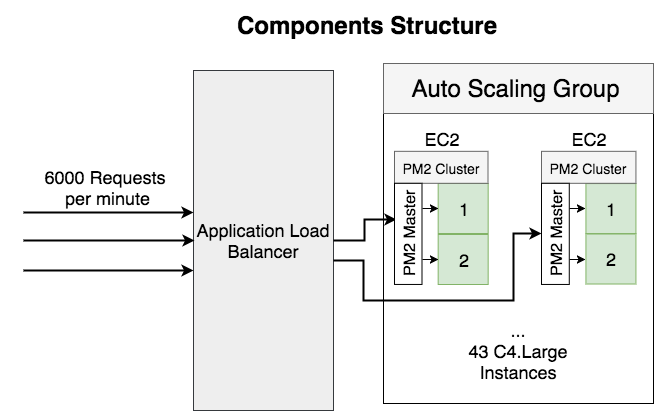
Here’s the background of the service before optimization:
- Serving 6000 requests per minute
- Using AWS Classic Load Balancer
- Running 25 C3.2xLarge EC2 instances which have 8-core CPU on each instance
- Using PM2 as the Process Manager and the Cluster Manager
- Written in Nodejs and using React 15 server-side render
The Original Problem
One day, I noticed a potential memory leak, but I’m not sure what’s the impact and I’m curious to know if the issue causing OOM on server?
Here’s the code snippet:
import defaults from 'superagent-defaults';
import superagent from 'superagent-bluebird-promise';

const request = defaults(superagent);

const recommendedJobs = (token, sessionId) => {
  return request
    .get(`${recommendedJobsUrl}/?maxJobs=3`)
    .set(‘Authorization’, token)
    .set(‘x-seek-ec-sessionid’, sessionId)
    .accept(‘application/json’)
    .type(‘application/json’)
    .then(response => response.body)
}
The problem here is reusing the defaults object. From the source code of superagent-defaults, I found that it pushes the method calls into an array.
var request = require(‘superagent’);
var protoMethods = Object.keys(request.Request.prototype);

function Context(superagent) {
  this.stack = []; // store operations on the context
}

var proto = Context.prototype = {};

each(protoMethods, function(method) {
  proto[method] = function() {
    this.stack.push({ method, args: arguments });
    return this;
  }
});
The protoMethods includes all the request.Request methods, e.g. get, set, accept, type, etc. That means the array will keep growing if we call the above recommendedJobs method multiple times.
Add Metrics for Memory Leak
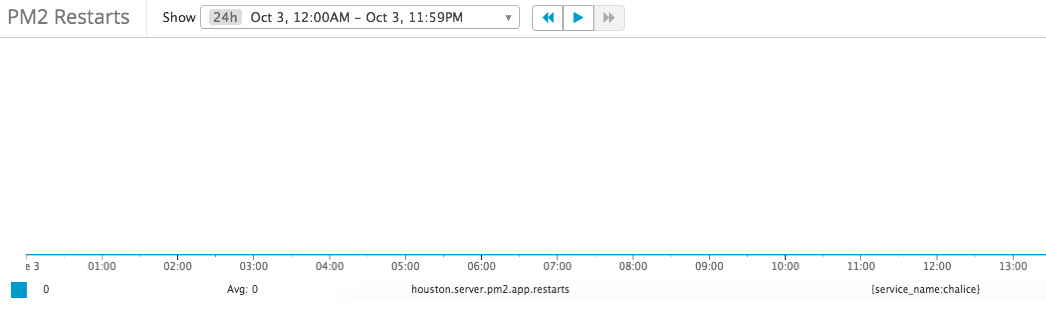
In order to understand the impact, I added following metrics for each pm2 process:
- Cpu usage
- Memory usage
- Process Restart count
Everything looks good, there’s no restart in production and no significant memory increase over time

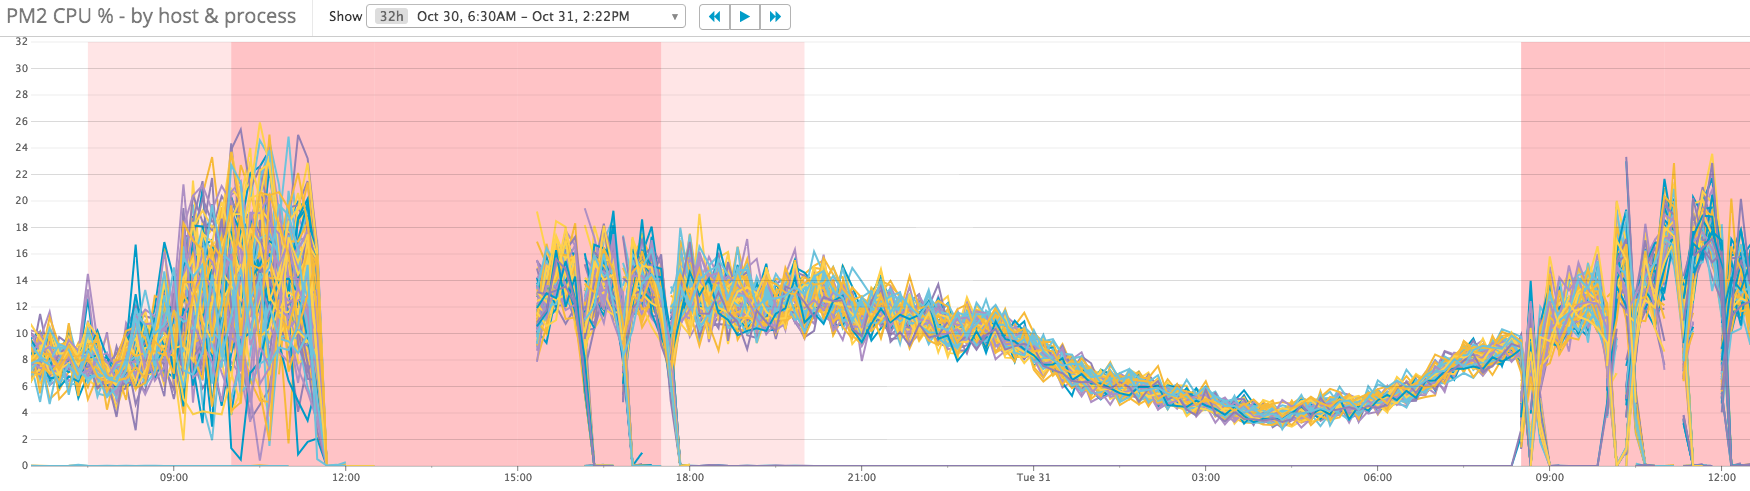
But from the memory usage metrics, we can notice that there are two levels of memory usage: 70 – 100 MB, 150 – 180 MB. What causing that happen? let’s compare with the CPU usage metrics:
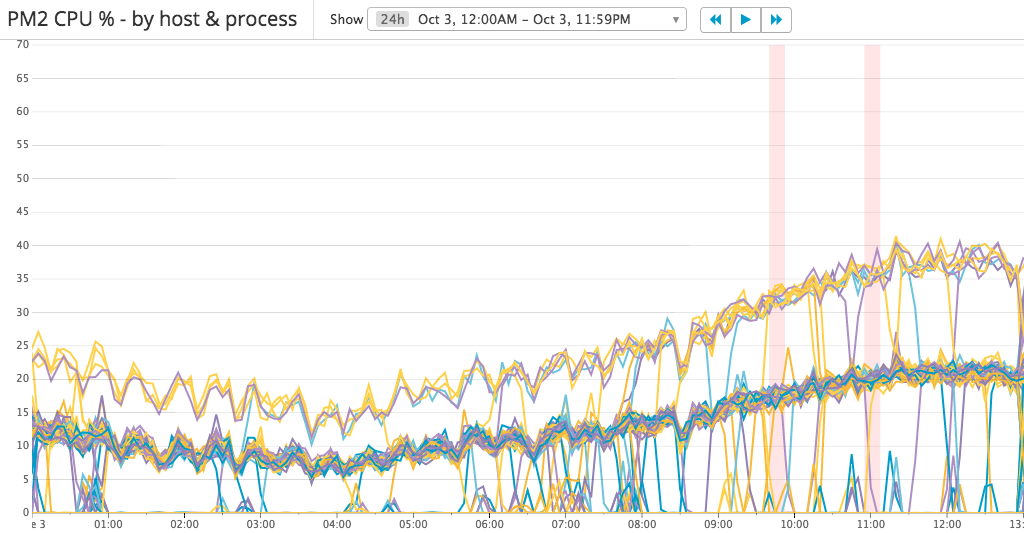
There are three levels of CPU usage: 0%, 10 – 20% and 20 – 40%. It looks like the requests are not load-balanced well. I checked the ELB metrics and found that each EC2 instance serving a similar amount of requests.
Then I noticed we’re using PM2 in cluster mode which internally using Nodejs cluster. From Nodejs cluster’s documentation,
The master process listens on a port, accepts new connections and distributes them across the workers in a round-robin fashion, with some built-in smarts to avoid overloading a worker process.
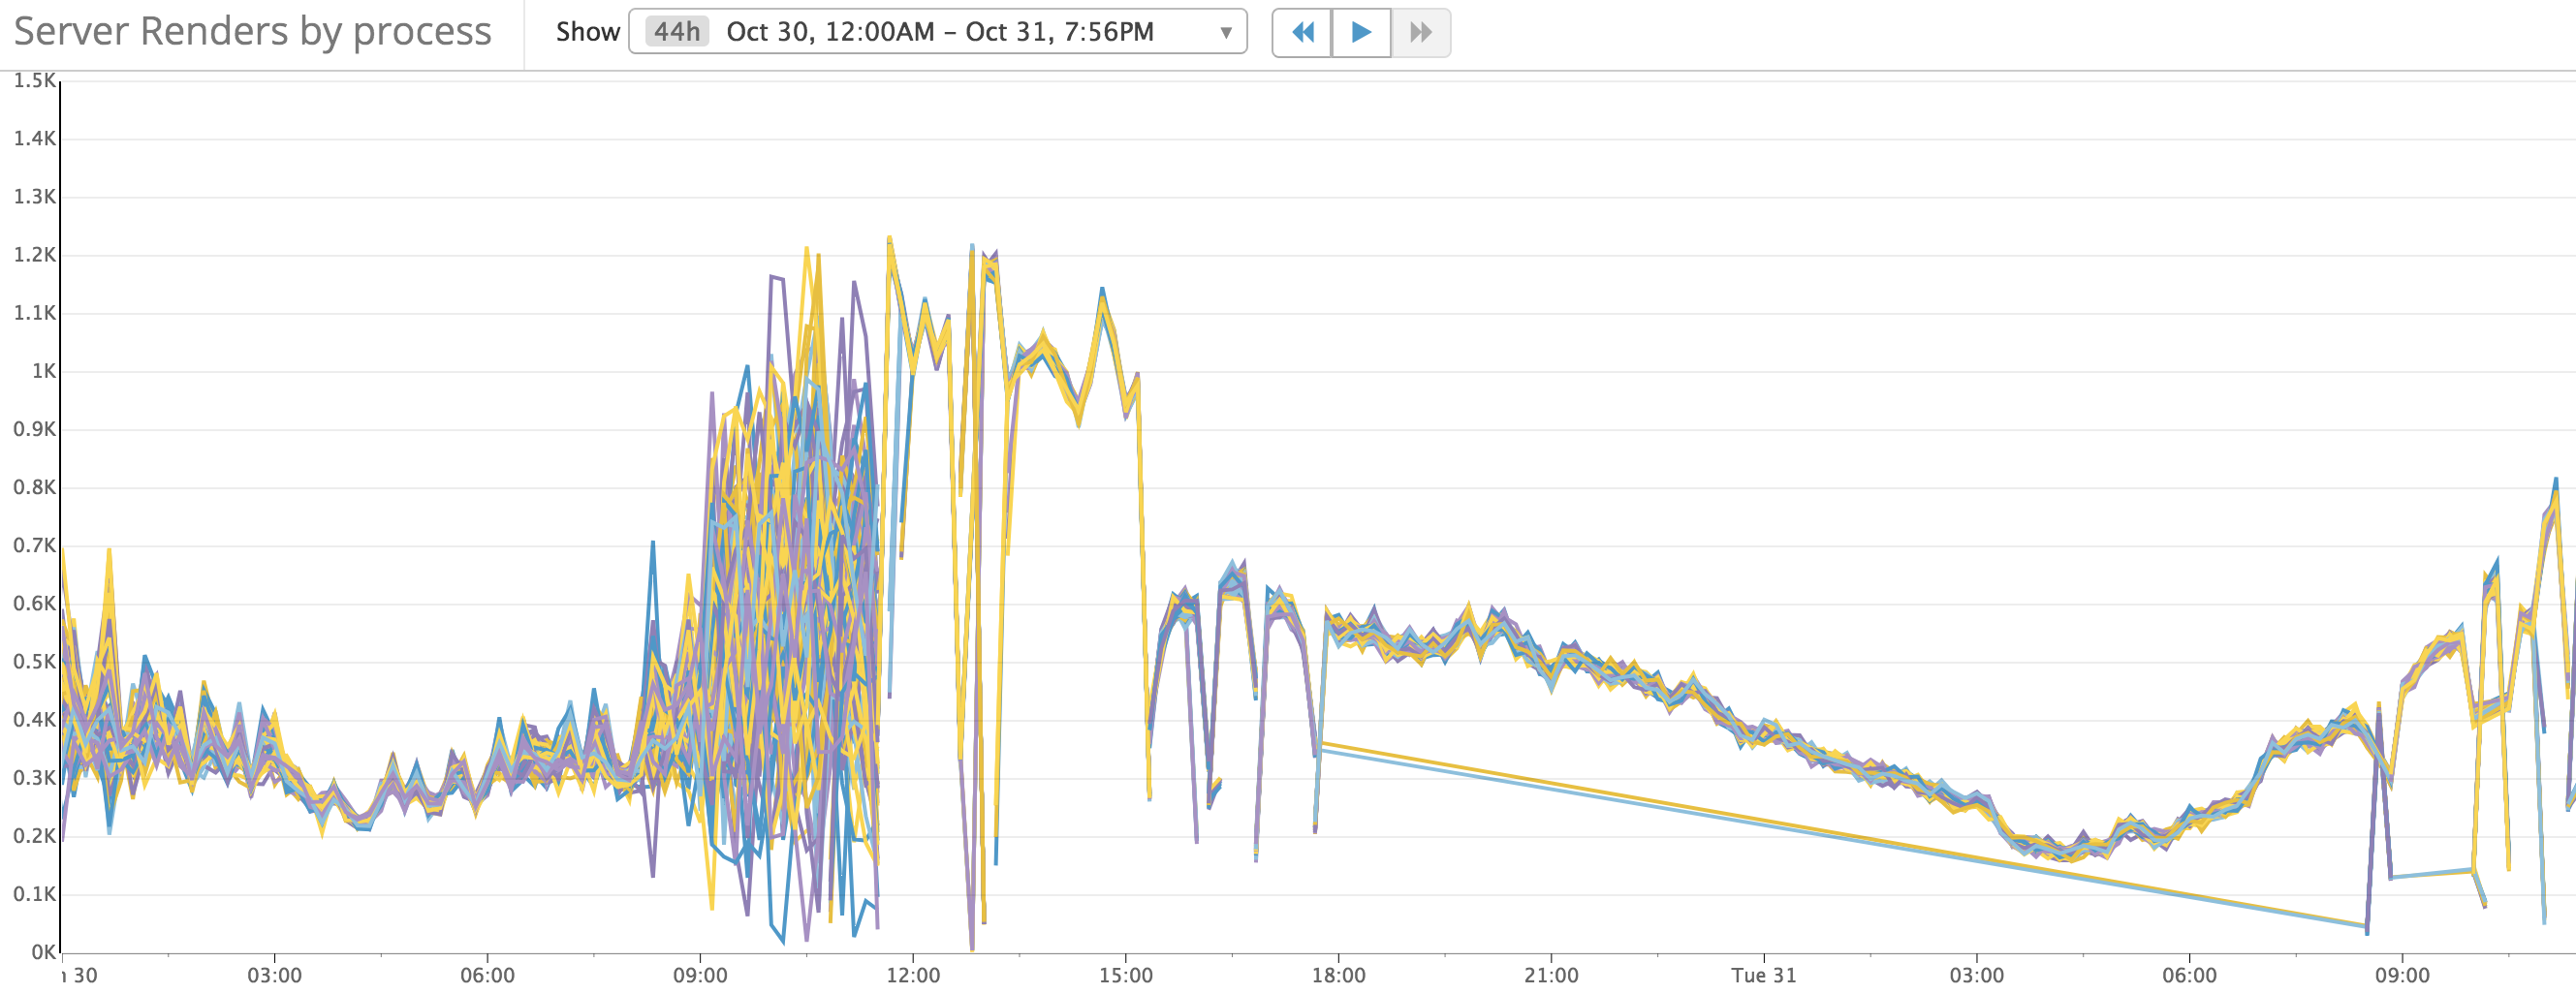
Build-in Smarts! What does it mean? Is it really good in our scenario? Do the requests distributed evenly? Let’s add other metrics to understand the cluster behavior: requests count per processor
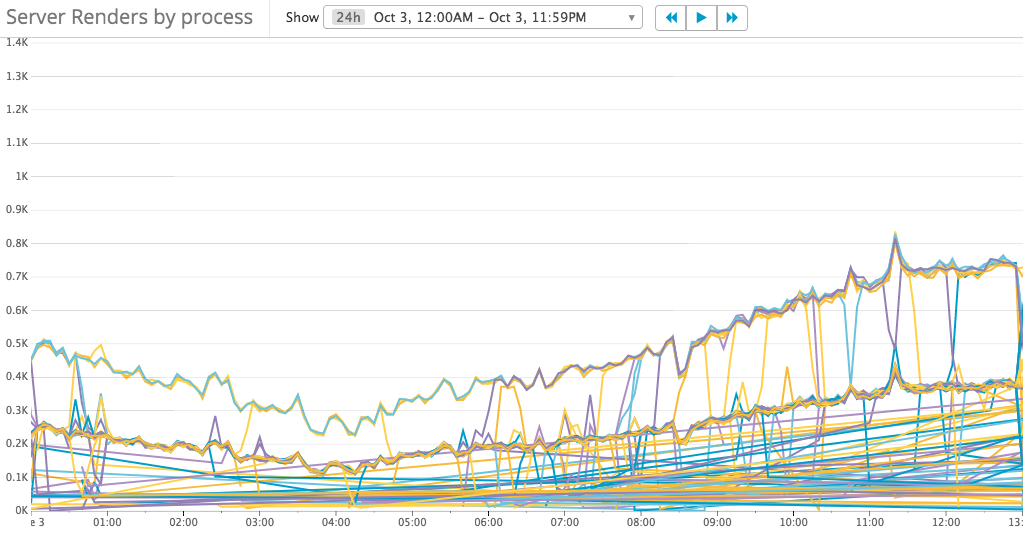
It’s not easy to understand the metrics, but we can find 3 groups of requests count:
- 150 – 400
- 300 – 750
- Others
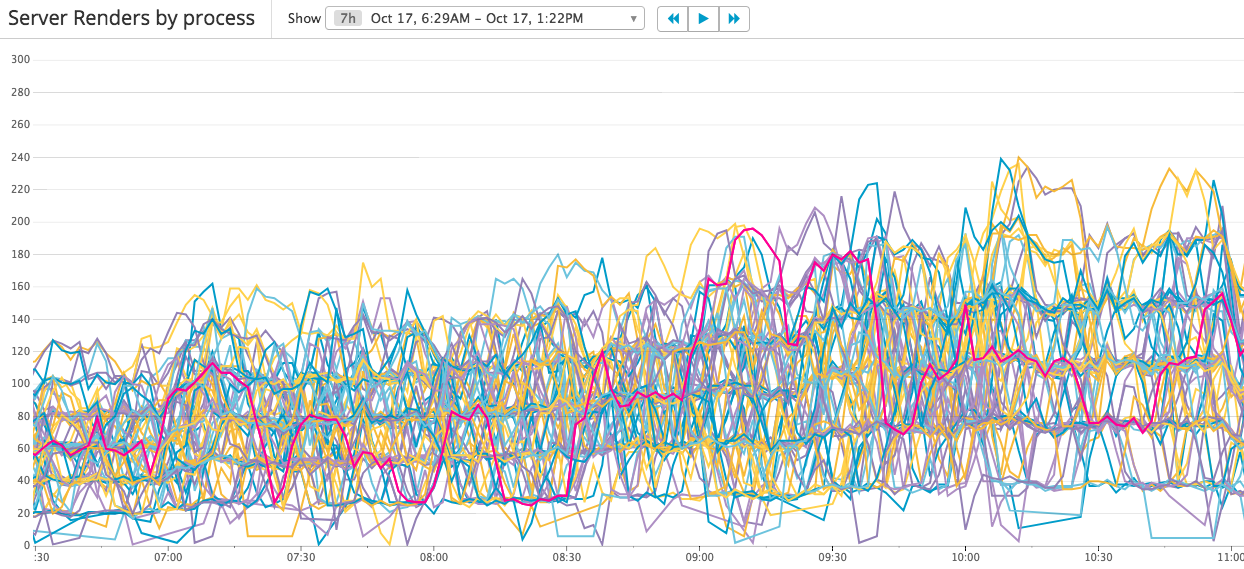
Let’s zoom in to view the metrics in a short time range:

Now the numbers are easy to read, there are 2 groups of requests count:
- 10
- 20
In fact, there’s the 3rd group in which requests count is 0, and there are 2/3 processes sit in this group. In another word, only 1/3 processes are serving requests which means the requests not load-balanced well.
Change Load Balancer Type
After comparing classical load balancer and application load balancer, I found that:
Classic Load Balancers use pre-open connections but Application Load Balancers do not.
Classic Load Balancers support the following protocols on front-end connections (client to load balancer): HTTP/0.9, HTTP/1.0, and HTTP/1.1.
Application Load Balancers support the following protocols on front-end connections: HTTP/0.9, HTTP/1.0, HTTP/1.1, and HTTP/2.
Since there’s no enough information on pre-open connections, and Application Load Balancers have more features, I decided to migrate to Application Load Balancer. Unfortunately, the requests dispatch behavior keeps the same while introduced many ALB 5xx errors every day. We’ll come back to this problem later in this article.
Change Instance Type
To improve the requests load-balancing, I tried to change to smaller instance type.
There are some benefits of this change:
- More processes will serving requests.
- Smaller granularity to scale. e.g. at the end of the tuning, we’re running 15 – 33 C4.large instances, if we change to C4.2xlarge, it’s 4 -> 8 instances, which is not a big difference.
- Reduce the risk of failed instances.
After this change, all the processes start working and the instances count reduced from 25 C3.2xLarge (100 C4.Large) to 43 C4.Large. But the previous problem still exists, requests still not distributed evenly with a noticeable pattern. The busiest processor processing 6 times requests over the idlest one.
Let’s review what’re the current problems:
- 5xx errors inside Load Balancer
- Requests not load-balanced well
Analyze the Load Balancer 5xx errors
By enabling access logs in LB and querying data in Athena, most errors are 502 bad gateway errors, and there’s no much detail information in access logs.
select substr(time, 1, 10) as date, count(*) as count
from alb_logs
where target_status_code <> elb_status_code
  and time < '2017-10-30'
  and elb_status_code = '502'
group by substr(time, 1, 10)
order by date

   date        count
2017-10-25      6543
2017-10-26      2689
2017-10-27      5626
2017-10-28      7717
From AWS doc, there’re possible causes:
The load balancer received a TCP RST from the target when attempting to establish a connection.
The target closed the connection with a TCP RST or a TCP FIN while the load balancer had an outstanding request to the target.
The target response is malformed or contains HTTP headers that are not valid.
In order to understand what’s causing the error, I decide to add Nginx as the reverse proxy on each machine. And then I realized that we can get more benefits from the Nginx:
- More load balancing strategies, e.g. round-robin, least connection
- Easier local testing for errors
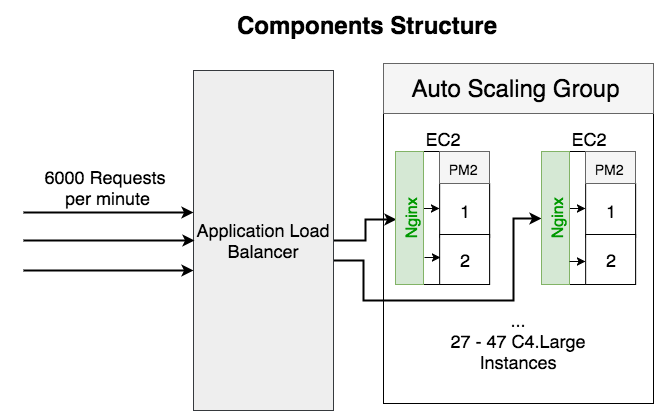
Adding Nginx as reversed proxy
Here’s the service structure after added Nginx as the reversed proxy:
The metrics looks perfect this time. Requests evenly distributed to all the processors.
Cpu usage becomes more consistent:
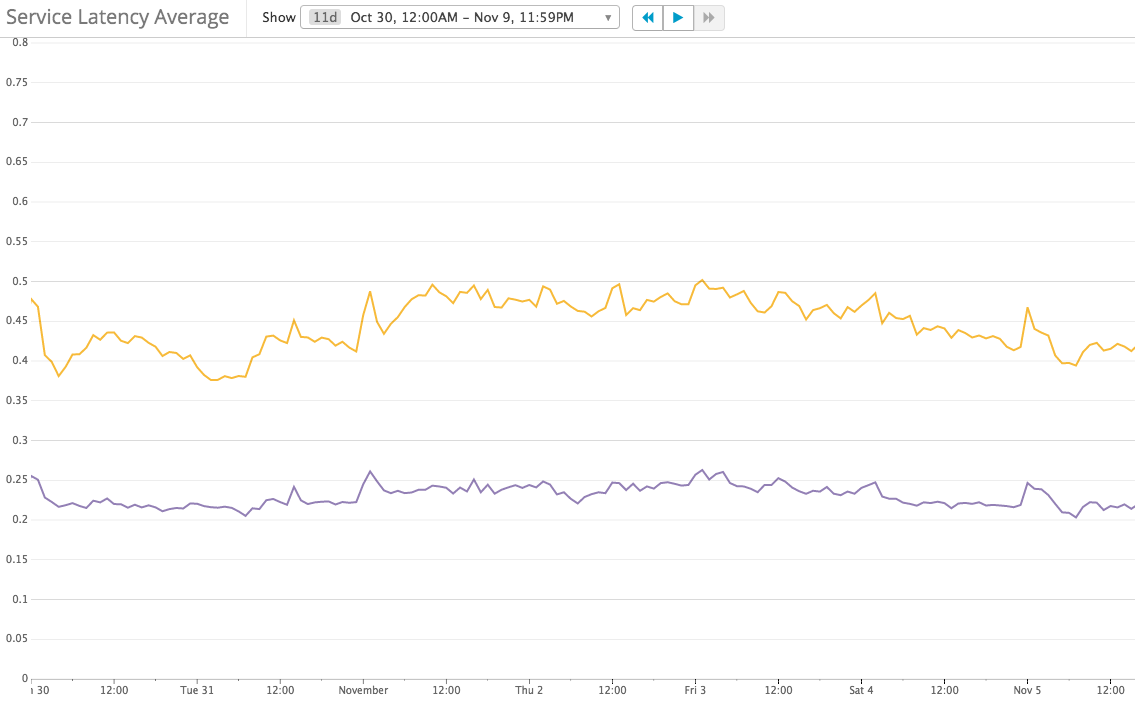
And Service Latency has not changed much:
And I also found out the reason for 502 errors: Http Upstream Keep Alive Timeout caused 502 errors. Nginx logged more detailed errors:
recv() failed (104: Connection reset by peer) while reading response header from upstream
More detailed explaination on analyzing this 502 error (connection reset error) in a separate article: https://theantway.com/2017/11/analyze-connection-reset-error-in-nginx-upstream-with-keep-alive-enabled/
Temporarily, we’re running the patched version of Nginx and waiting for the patch to be merged into master, hopefully.
The biggest benefit of introducing Nginx is enabled auto-scaling because both of the CPU cores are working at the same load.
- Instance count reduced from 43 -> 27 – 47
- Scaling policy based on CPU usage: 10% – 15%
Upgrade to React 16
React V16 released with a big optimization on Server Side Render. After upgrade, the instances count reduced to 15 – 32, average at 27%. compare to the original costs, that’s a 73% reduction.
The duration for React Server Render improved 40%

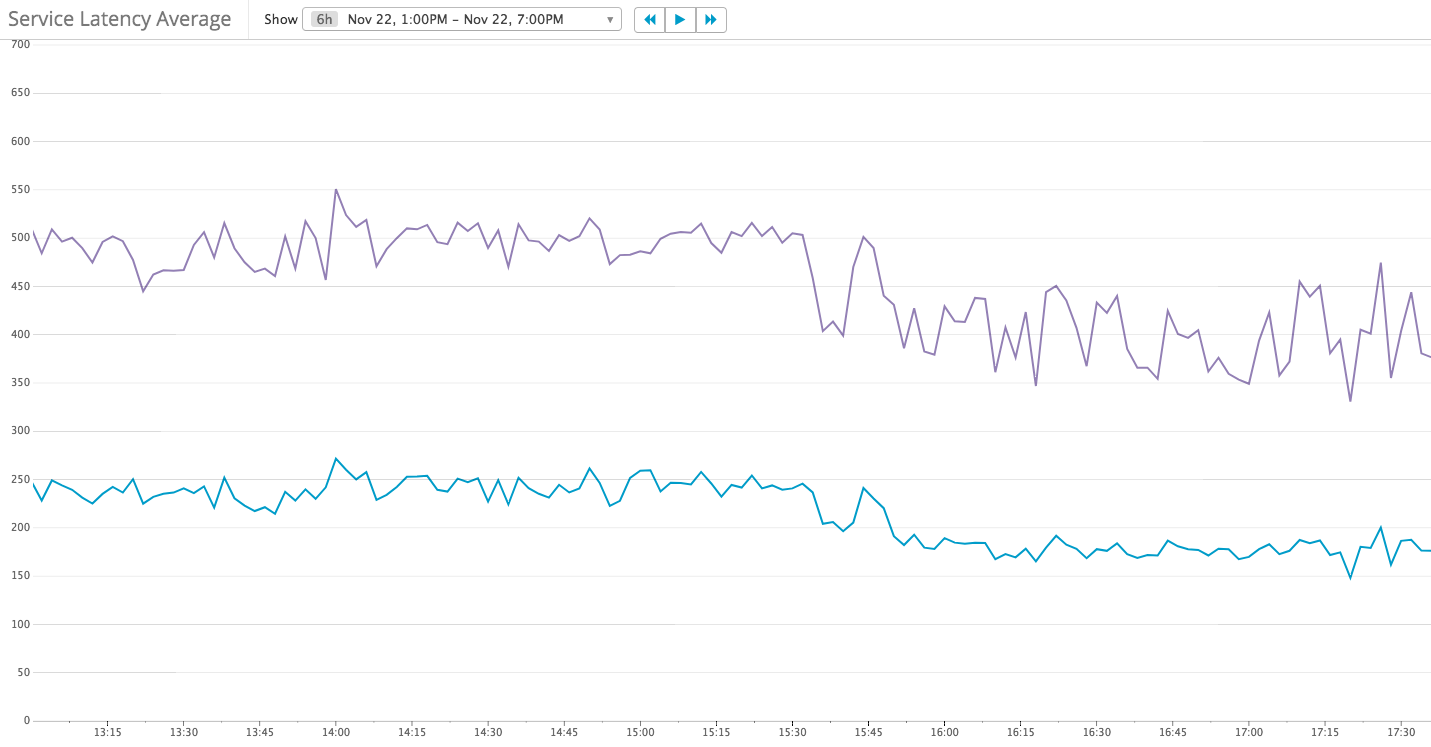
Service Latency reduced from 230 – 240 ms to 170 – 180 ms
Cpu usage also reduced, so I changed the auto-scaling policy to
- Add 3 instances when CPU usage greater than 20%
- Remove 1 instance when CPU usage less than 15%
What didn’t work for us
- ECS Service
Application Load Balancer support dynamic ports and ECS services can bind docker containers to Application LB.
But because we are using Elastic Beanstalk for blue/green deployment, and there’s no support of ECS services in Elastic Beanstalk, It will take much more time to migrate to other deployment tools, so I didn’t continue on this approach. - Run multiple processes per CPU core, e.g. 2 x processor
React server-side render is a sync method call and takes up to 120 ms to run. If the process running reactRender, it would block other requests. The assumption is: By running multiple processes per CPU core, we can get the benefit of os process schedulingSo I tried to run 2 processes per CPU core to get the benefit of os process scheduling, but it made the performance even worse. Here are the results:
- One process per CPU core is about 10 ms faster in average react render and service response
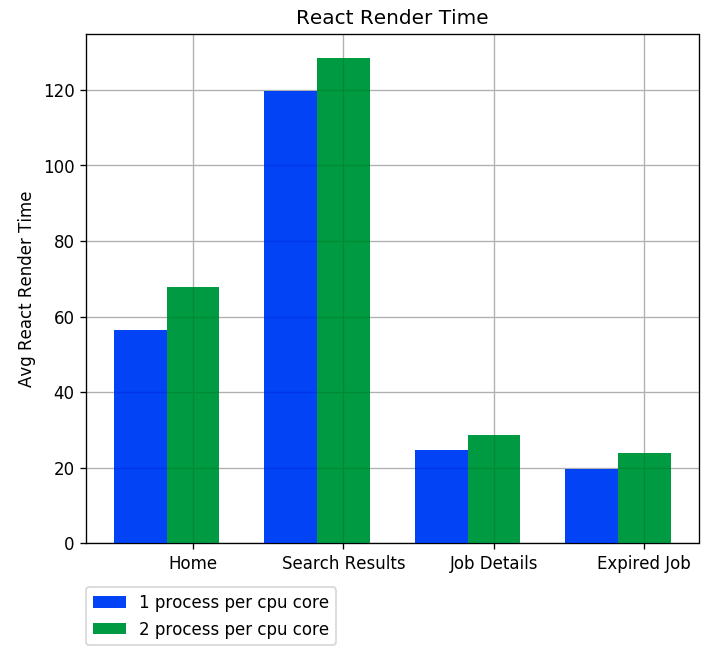
Average React Render Time 
Average Service Latency - The max React Render time has a big difference, from 30% to 50%
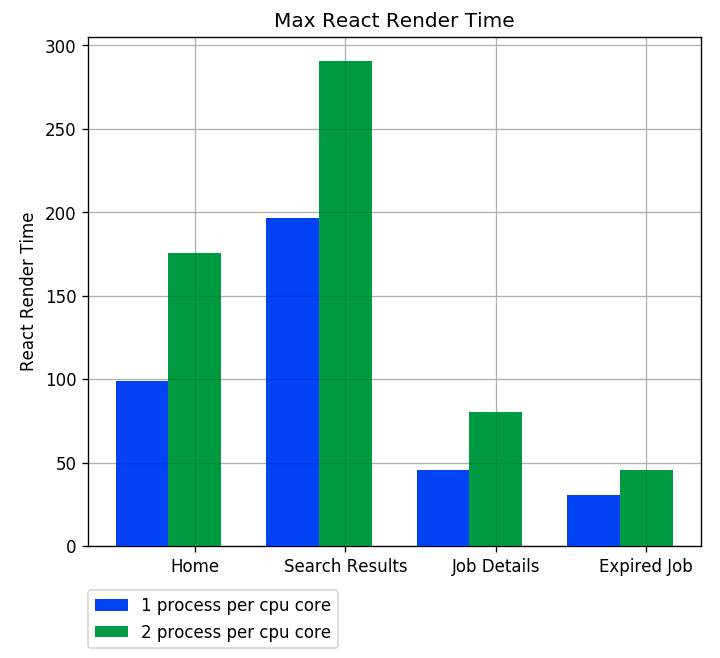
Max React Render Time - One process per CPU core save 12.5% costs: Instance count changed from 32 to 28
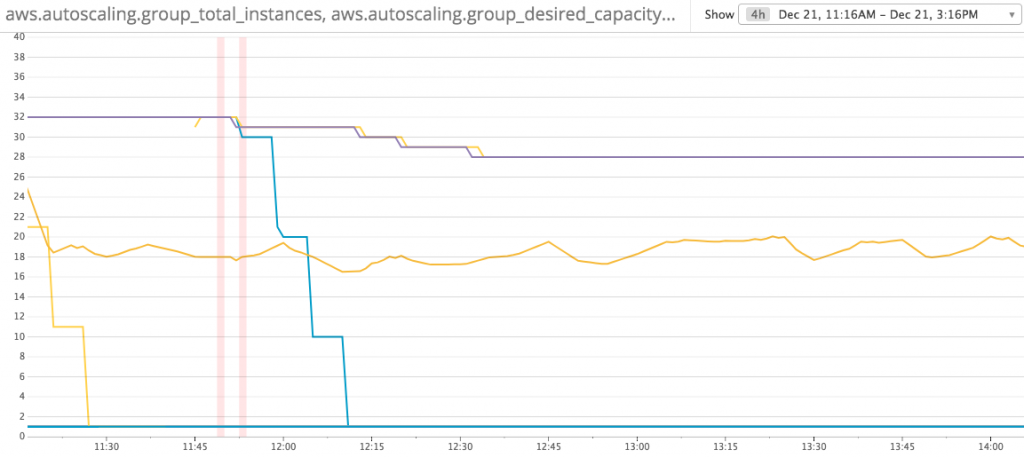
Instance Count Reduced after change to 1 process per CPU core
- One process per CPU core is about 10 ms faster in average react render and service response
- Serverless (AWS Lambda is very slow for these CPU intensive work)
- t2.large is 3 times slow compare to c4.large

Conclusion
- Always set up metrics before working on optimization
- Do not trust the documents, understand the behavior and then do your own measure
- Metrics-driven development is awesome